
Publications
2019 Refinement
1st Corrigenda to the 2019 Refinement to the 2006 IPCC Guidelines for National Greenhouse Gas Inventories
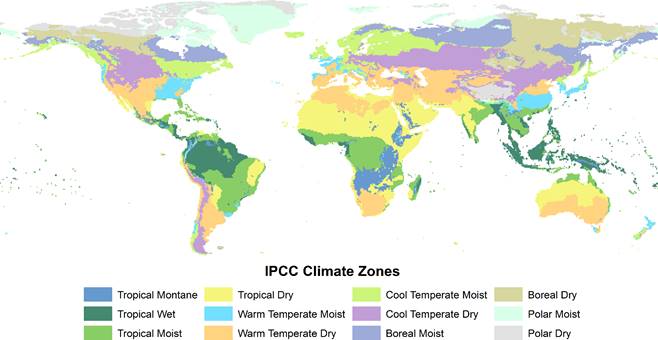
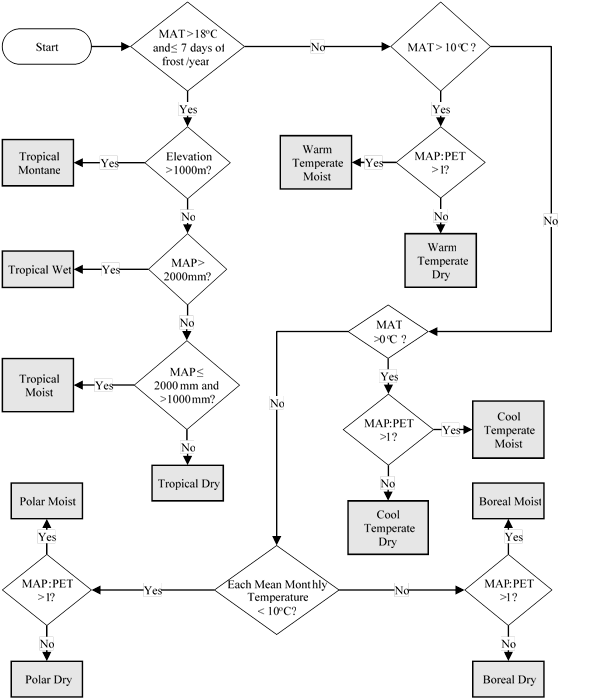
- In Volume 4, Chapter 3, the climate zone map in Figure 3A.5.1 (Page 3.47) was generated inconsistently with the decision tree in Figure 3A.5.2 (page 3.48). In Figure 3A.5.1, the threshold between moist and dry climates were set by a mean annual precipitation: potential evapotranspiration ratio of 0.5 for temperate regions. In contrast, Figure 3A.5.2 set the threshold at 1. Further, the map was created without considering the frost-free day criteria in first diamond of the diagram. To make both consistent with each other, Figure 3A.5.1 should be replaced with the figure below.
- Along with the correction above, the text in one of the diamonds in Figure 3A.5.2 should be amended from "All Months Average <10°C?" to "Each Mean Monthly Temperature < 10°C?", as shown in the figure below.
- In the "References" section on page 3.53, the sub-heading "REFERENCES (NEW) FOR THE 2006 REFINEMENT" should be replaced with "REFERENCES NEWLY CITED IN THE 2019 REFINEMENT".
Sandro FEDERICI
Head, Technical Support Unit
IPCC Task Force on National Greenhouse Gas Inventories
September 2021
© 2026 Intergovernmental Panel on Climate Change (IPCC)